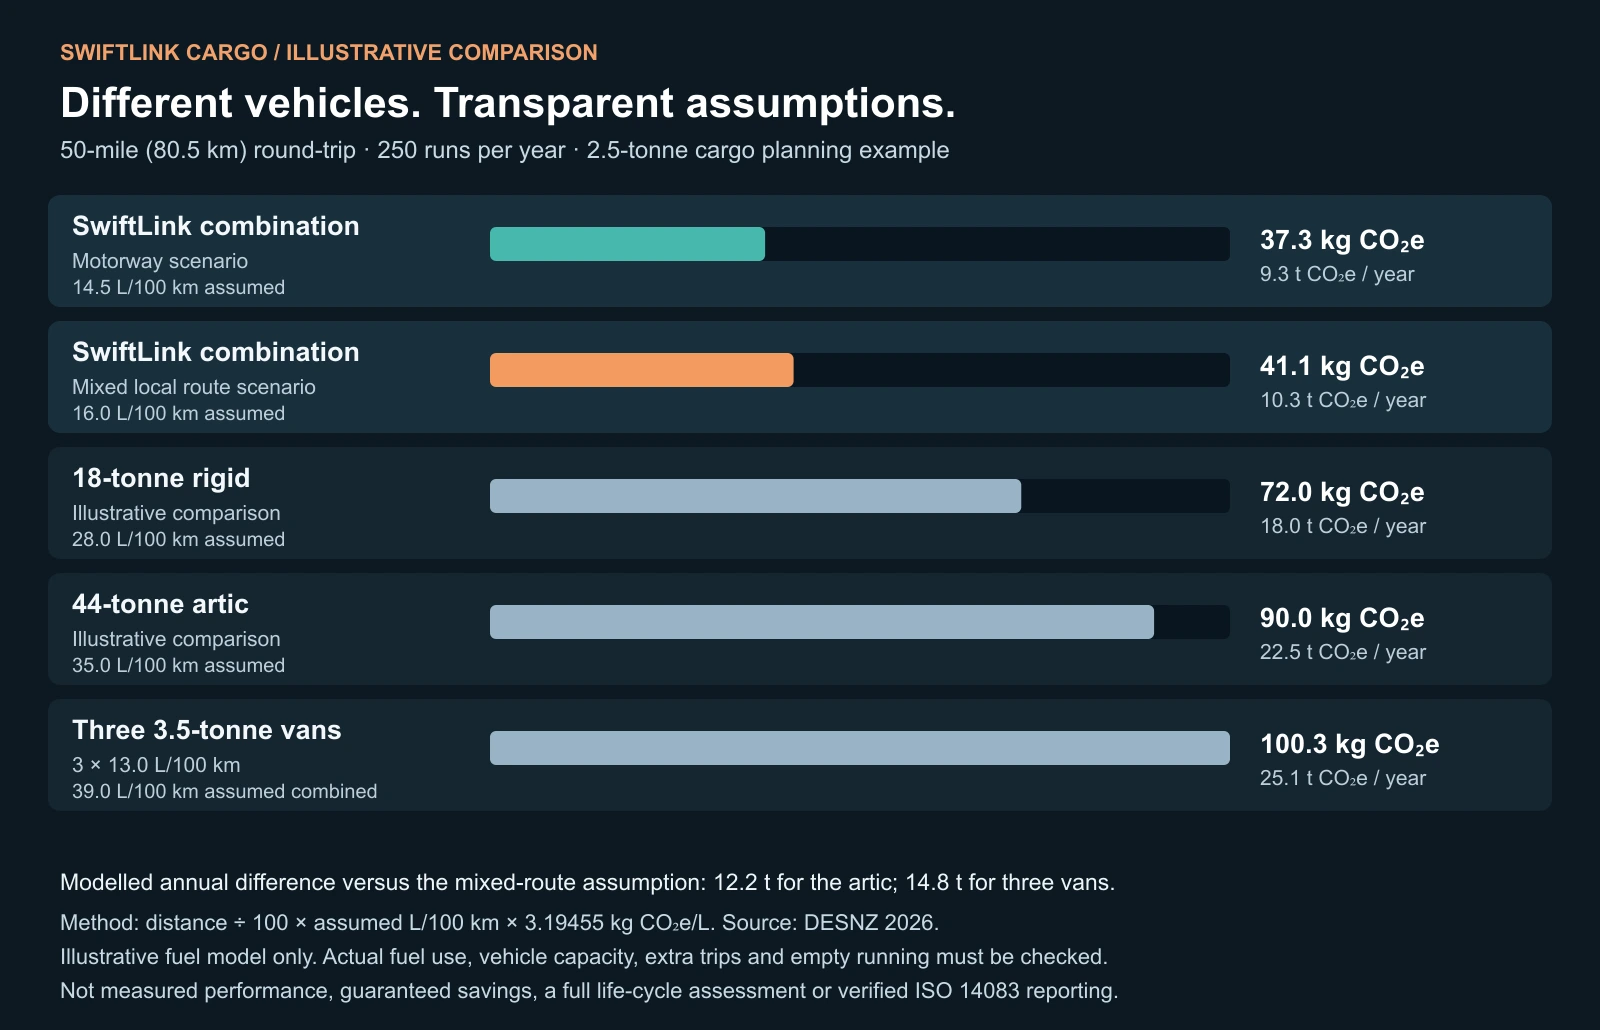
12.2 tonnes CO₂e
Between the mixed-route SwiftLink assumption and the 44-tonne artic assumption.

For bulky, lightweight freight, useful space matters. We look at the load, the vehicle and the route together—then make the assumptions behind any carbon comparison clear.
Talk through your regular route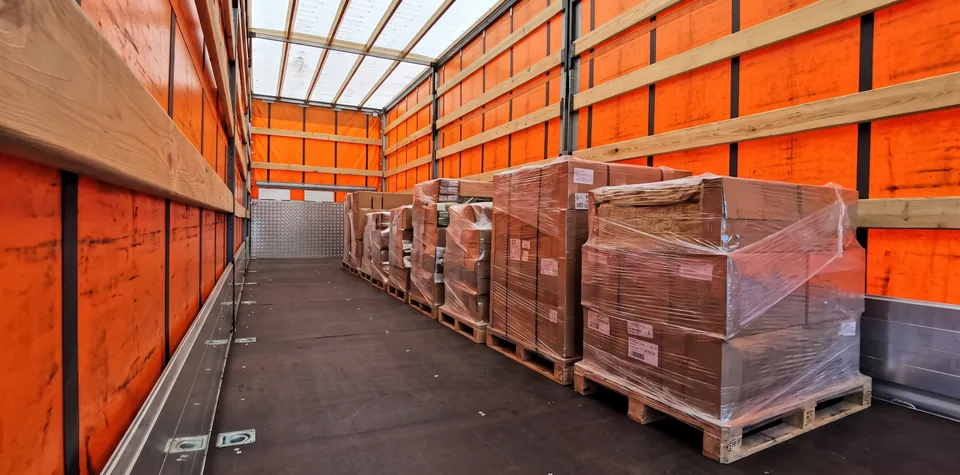 Built around bulky, lightweight goods
Our curtainsider and trailer offer approximately 64.5 m³ of space with up to 3,100 kg combined payload. The towing vehicle’s 900 kg limit and trailer’s 2,200 kg limit both apply.
Consolidating suitable freight can change how many vehicles or journeys a job needs. The benefit depends on the goods, loading arrangement and route—not just the size of the vehicle.
Check the vehicle and loading detailsThis model explores fuel use on a Berkshire shuttle. It helps frame a conversation about your route; it does not predict the result for every consignment.
kg CO₂e per 50-mile (80.5 km) round-trip
Fuel rates are assumptions supplied for this model. The figures are estimates, not measured SwiftLink results or guaranteed savings. Vehicle capacity and the number of journeys required must be checked for the actual load.
Between the mixed-route SwiftLink assumption and the 44-tonne artic assumption.
Between the mixed-route SwiftLink assumption and three vans each making the same journey.
These differences apply only to the stated fuel rates and 250 runs. They do not establish that each example vehicle can carry the same consignment in one trip. Body dimensions, payload, loading access, additional trips and empty running can change the comparison.
“Well-to-wheel” here includes emissions from using the diesel and from producing and supplying it. The calculation uses the UK average biofuel-blend diesel factors.
Read the UK Government 2026 factorsAnnual tonnes = emissions per run × 250 ÷ 1,000. Figures are rounded for display. Biogenic CO₂ is reported separately in the government factors and is not added to these totals.
This is a fuel-based illustration, not a full life-cycle assessment or verified ISO 14083 calculation. It does not establish compliance with SECR, PPN 006 or a customer’s Scope 3 reporting requirements. Audited reporting needs appropriate activity data, boundaries and allocation.
Pallet count, dimensions, gross cargo weight and unit limits. Available space only helps when the goods can be carried safely and legally.
Collection, delivery, return travel, traffic and loading time. A useful comparison must reflect the movement your business actually needs.
Measured fuel and route data are needed to establish actual emissions. We agree what information is available before making any route-specific claim.
The company describes the vehicle as Euro 6. That emissions standard does not establish a particular CO₂ saving; route and clean-air-zone requirements are checked separately.
Share the goods, both locations and the frequency. We’ll discuss the practical fit and what a fair comparison would need.
contact@swiftlinkcargo.co.ukPrefer email? Send your question directly.